 |
Net Information
 Who We Are Who We Are
Awards
Net Procedures
FAQ's
Net Control Information
Newsletters
Contributions
Contribution Info
Contributors
Weather
About Advisories
Dopplar Radar Imagery
Satellite Imagery
Local Storm Statements
Local Post Storm Reports
Aircraft Recon
Buoy & C-Man Data
Email Subscriptions
Terms & Tools
Acronyms
Beaufort Wind Scale
Glossary
NHC FAQs
Hurricane Tracking Maps
Conversion Tools
Saffir-Simpson Scale
Outreach and Education
Prepare
Storm Surge
Storm Names
Miscellaneous
Disclaimer
Privacy Policy
Comments
|
|
Tropical Cyclone Climatology
The following information courtesy of the National Hurricane Center.
Contents
Overview
A tropical cyclone is a rotating, organized system of clouds and thunderstorms that originates over tropical or subtropical waters and has a closed low-level circulation. Tropical cyclones
rotate counterclockwise in the Northern Hemisphere. They are classified as follows:
- Tropical Depression: A tropical cyclone with maximum sustained winds of 38 mph (33 knots) or less.
- Tropical Storm: A tropical cyclone with maximum sustained winds of 39 to 73 mph (34 to 63 knots).
- Hurricane: A tropical cyclone with maximum sustained winds of 74 mph (64 knots) or higher. In the western North Pacific, hurricanes are called typhoons;
similar storms in the Indian Ocean and South Pacific Ocean are called cyclones.
- Major Hurricane: A tropical cyclone with maximum sustained winds of 111 mph (96 knots) or higher, corresponding to a Category 3, 4 or 5 on the Saffir-Simpson
Hurricane Wind Scale.
Tropical cyclones forming between 5 and 30 degrees North latitude typically move toward the west. Sometimes the winds in the middle and upper levels of the atmosphere change and steer the cyclone
toward the north and northwest. When tropical cyclones reach latitudes near 30 degrees North, they often move northeast.
Atlantic & Eastern Pacific Climatology
The Atlantic hurricane season runs from June 1st to November 30th, and the Eastern Pacific hurricane season runs from May 15th to November 30th. The Atlantic basin includes the Atlantic Ocean,
Caribbean Sea, and Gulf of Mexico. The Eastern Pacific basin extends to 140°W.
The following figures and tables describe the progress of a typical hurricane season in terms of the total number of tropical systems and hurricanes produced throughout the year in the Atlantic
and East Pacific basins.
In the figures, curves represent the average cumulative production of all named tropical systems, all hurricanes, and those hurricanes which were Category
3 or stronger in those basins.
For example, by the beginning of September in an average year we would expect to have had four named systems, two of which would be hurricanes and one of which would be of category 3 or greater
in strength.
The tables list benchmark dates when a given number of tropical systems, hurricanes, or category 3 storms should have been generated.
![[graph of average cumulative number of Atlantic basin systems per year]](images/cum-average_Atl_1966-2009_sm.gif)
The average cumulative number of Atlantic systems per year, 1966-2009 |
|
![[graph of average cumulative number of Eastern Pacific basin systems per year]](images/cum-average_Pac_1971-2009_sm.gif)
The average cumulative number of Eastern Pacific systems per year, 1971-2009 |
Table 1. Progress of the average Atlantic season (1966-2009). Date upon which the following number of events would normally have occurred.
| Number |
Named systems |
Hurricanes |
Category 3 or greater |
| 1 |
July 9 |
Aug 10 |
Sep 4 |
| 2 |
Aug 1 |
Aug 28 |
Oct 3 |
| 3 |
Aug 13 |
Sep 9 |
- |
| 4 |
Aug 23 |
Sep 21 |
- |
| 5 |
Aug 31 |
Oct 7 |
- |
| 6 |
Sep 8 |
Nov 23 |
- |
| 7 |
Sep 16 |
- |
- |
| 8 |
Sep 24 |
- |
- |
| 9 |
Oct 4 |
- |
- |
| 10 |
Oct 19 |
- |
- |
| 11 |
Nov 23 |
- |
- |
Table 2. Progress of the average eastern Pacific season (1971-2009). Date upon which the following number of events would normally have occurred.
| Number |
Named systems |
Hurricanes |
Category 3 or greater |
| 1 |
June 10 |
June 26 |
July 19 |
| 2 |
June 25 |
July 14 |
Aug 19 |
| 3 |
July 5 |
July 29 |
Sep 20 |
| 4 |
July 14 |
Aug 12 |
- |
| 5 |
July 22 |
Aug 26 |
- |
| 6 |
July 30 |
Sep 9 |
- |
| 7 |
Aug 7 |
Sep 24 |
- |
| 8 |
Aug 15 |
Oct 15 |
- |
| 9 |
Aug 24 |
- |
- |
| 10 |
Sep 1 |
- |
- |
| 11 |
Sep 10 |
- |
- |
| 12 |
Sep 19 |
- |
- |
| 13 |
Sep 28 |
- |
- |
| 14 |
Oct 11 |
- |
- |
| 15 |
Nov 5 |
- |
- |
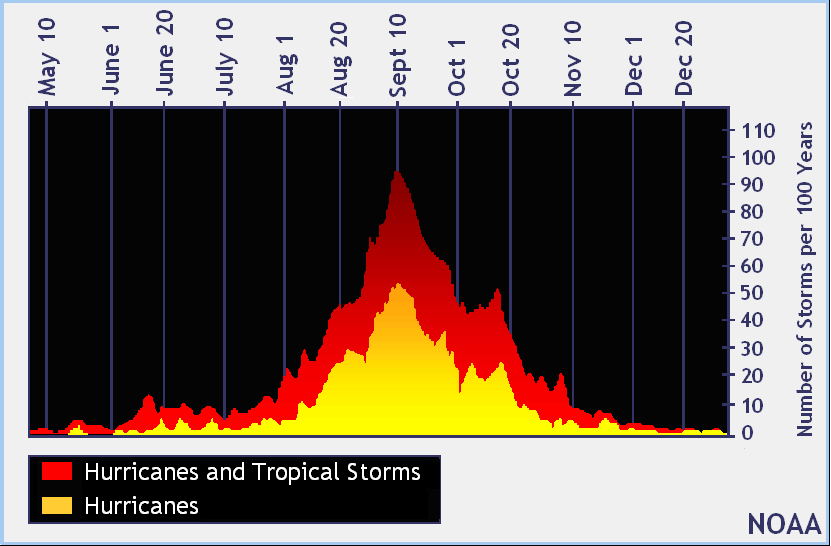
Number of Tropical Cyclones per 100 Years
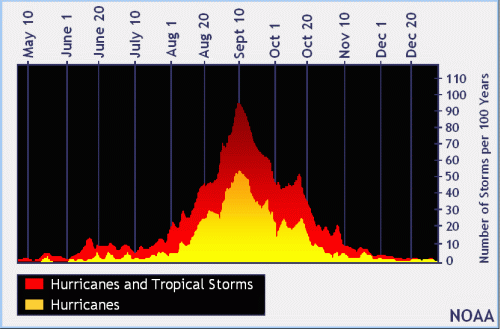
The official hurricane season for the Atlantic Basin (the Atlantic Ocean, the Caribbean Sea, and the Gulf of Mexico) is from 1 June to 30 November. As seen in the graph above, the peak of
the season is from mid-August to late October. However, deadly hurricanes can occur anytime in the hurricane season.
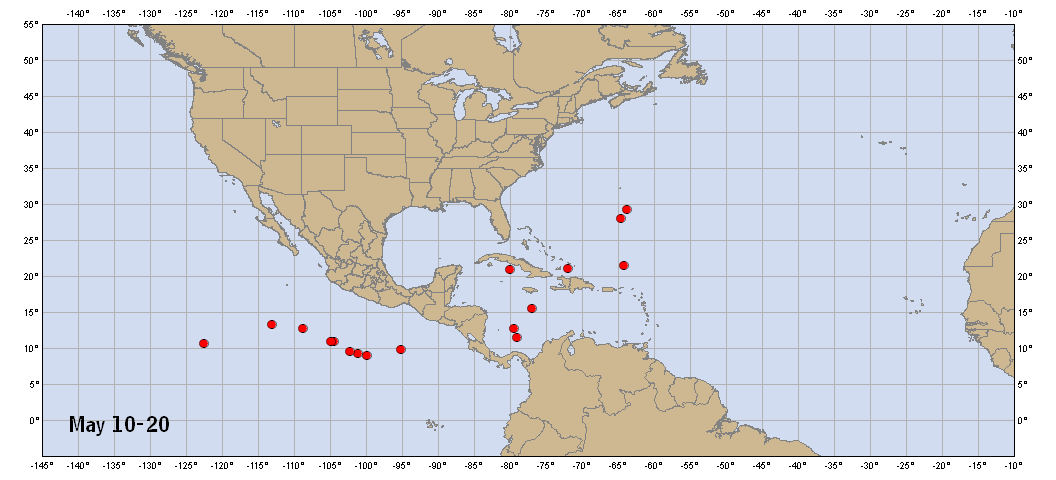
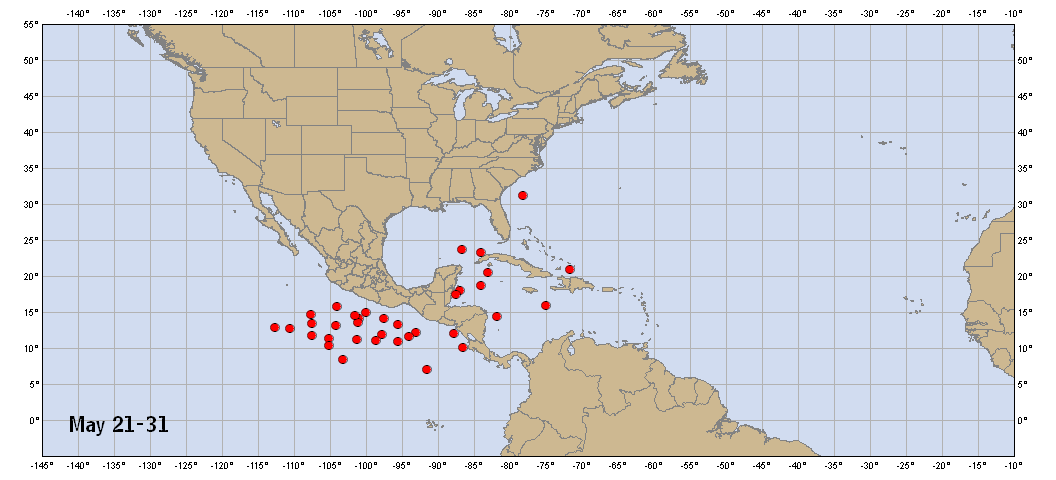
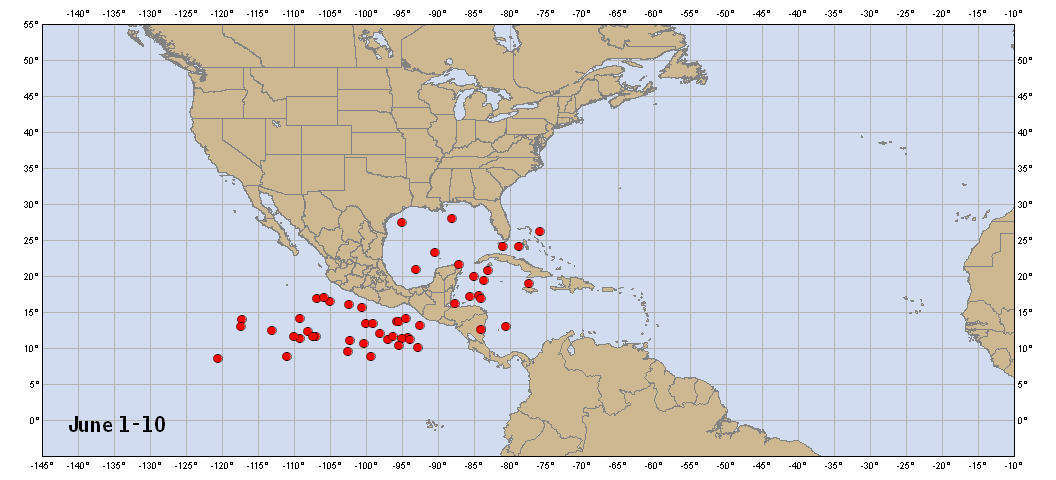
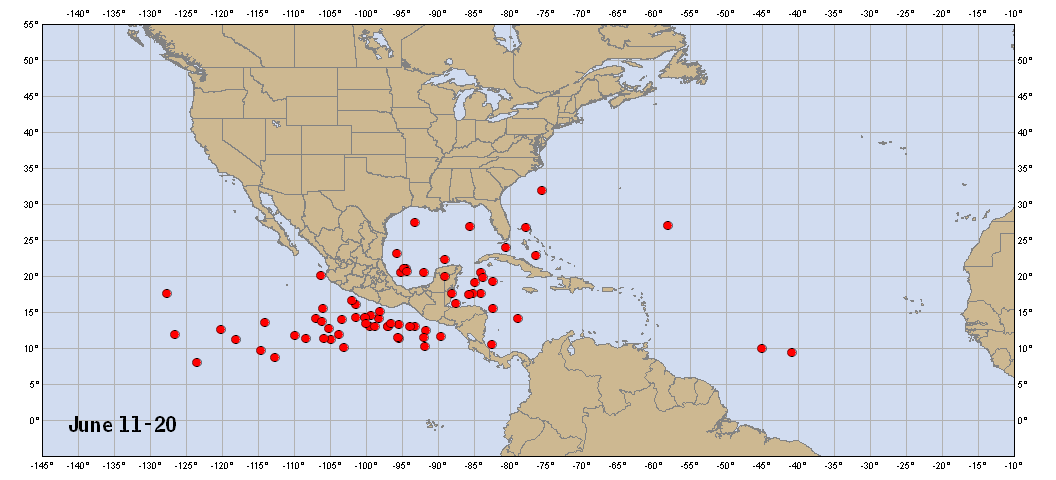
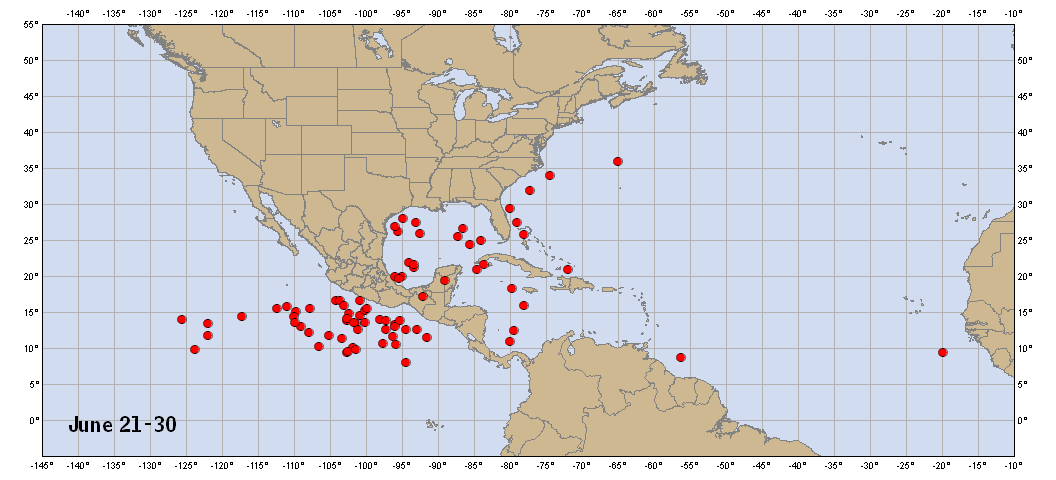
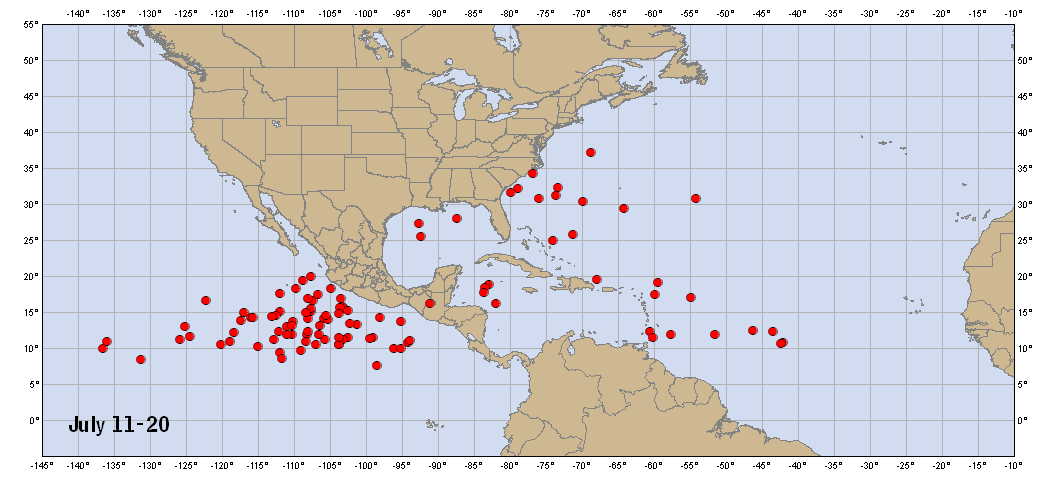
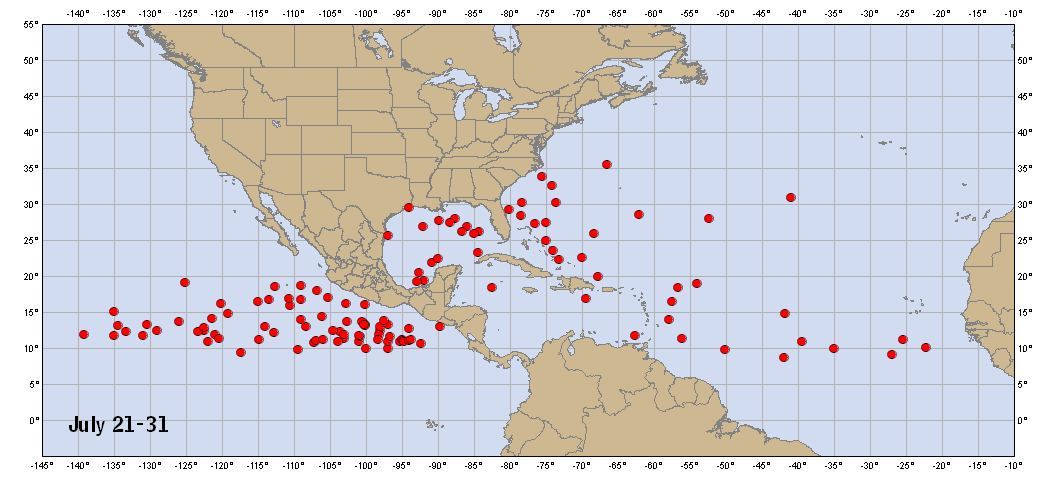
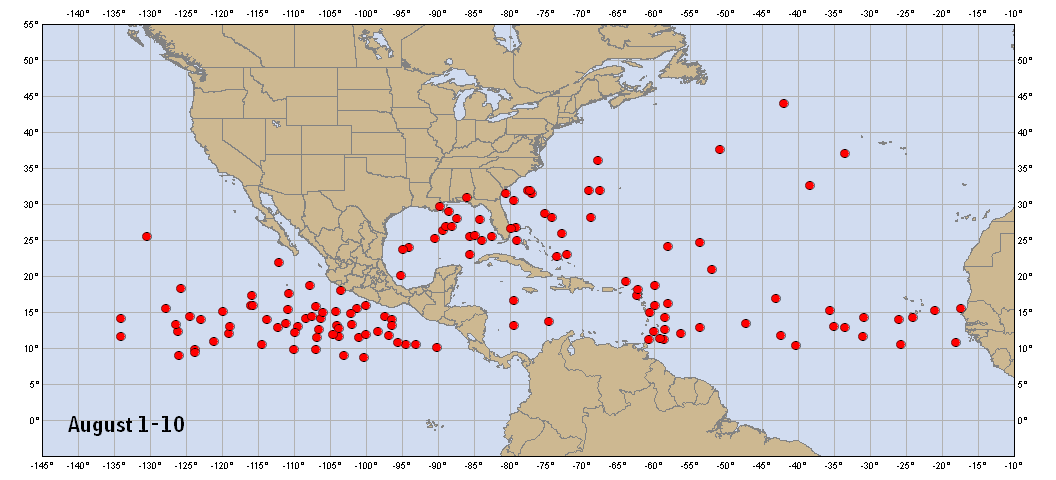
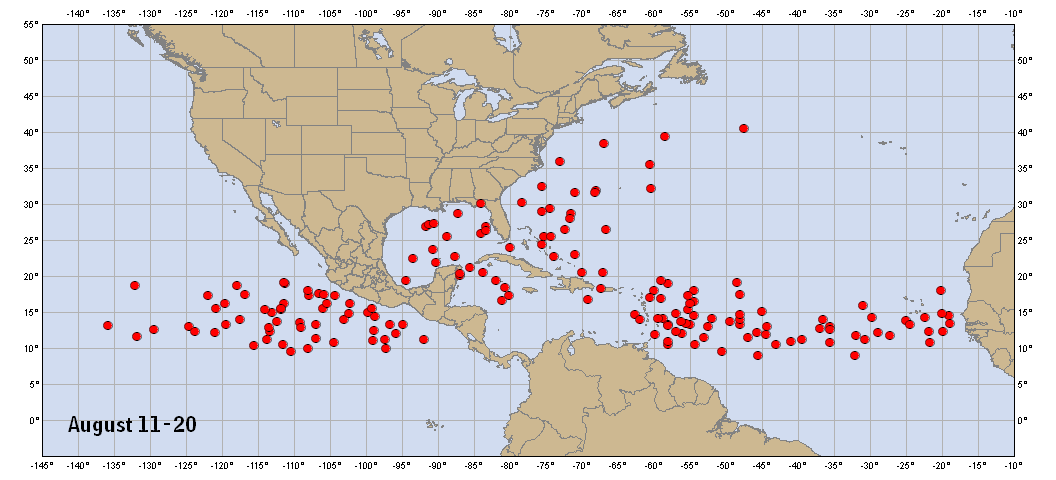
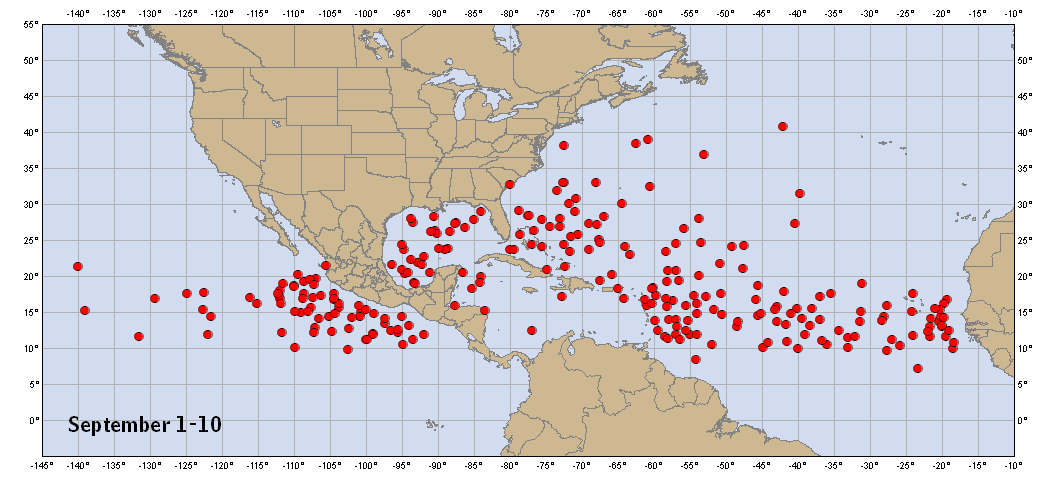
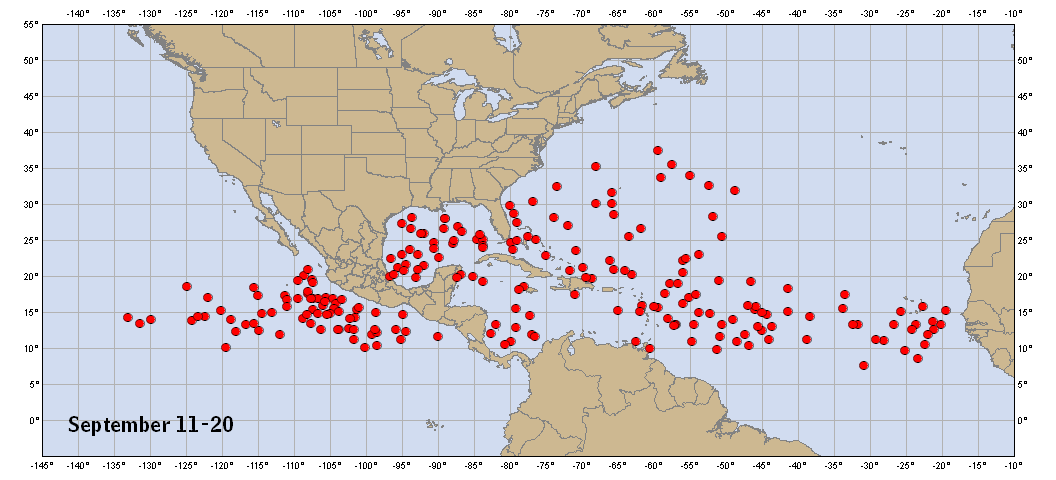
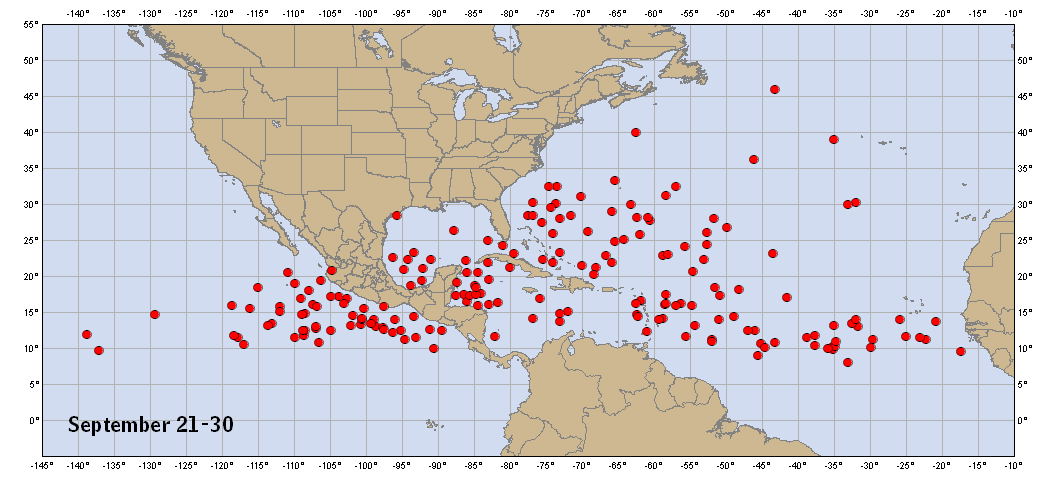
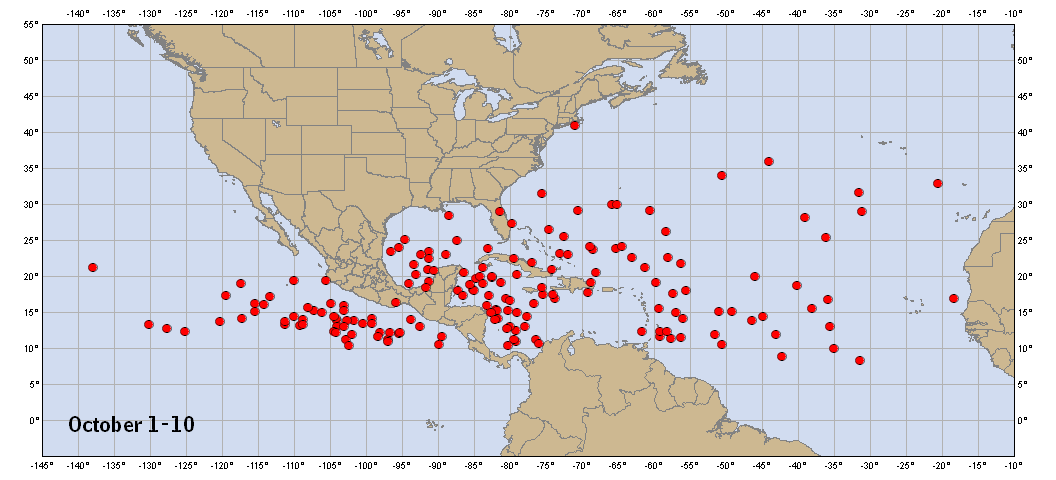
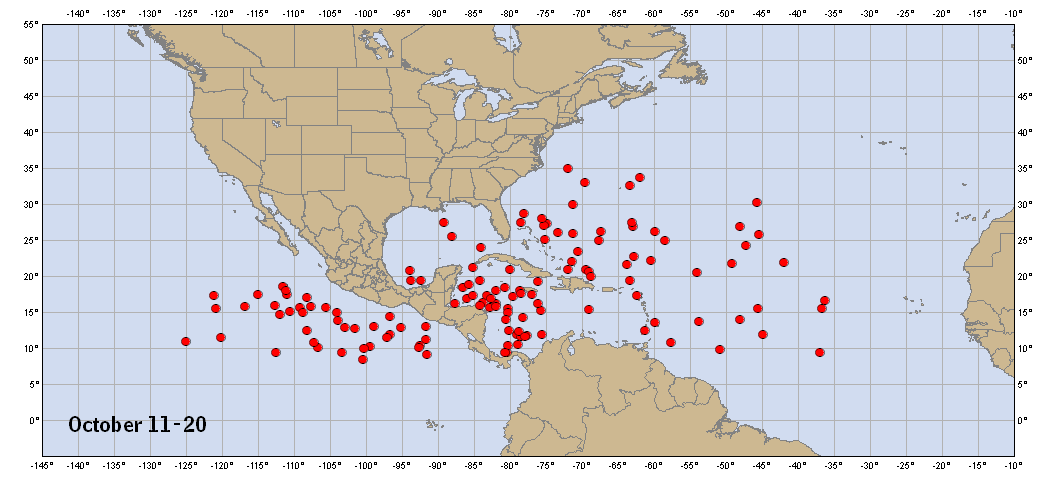
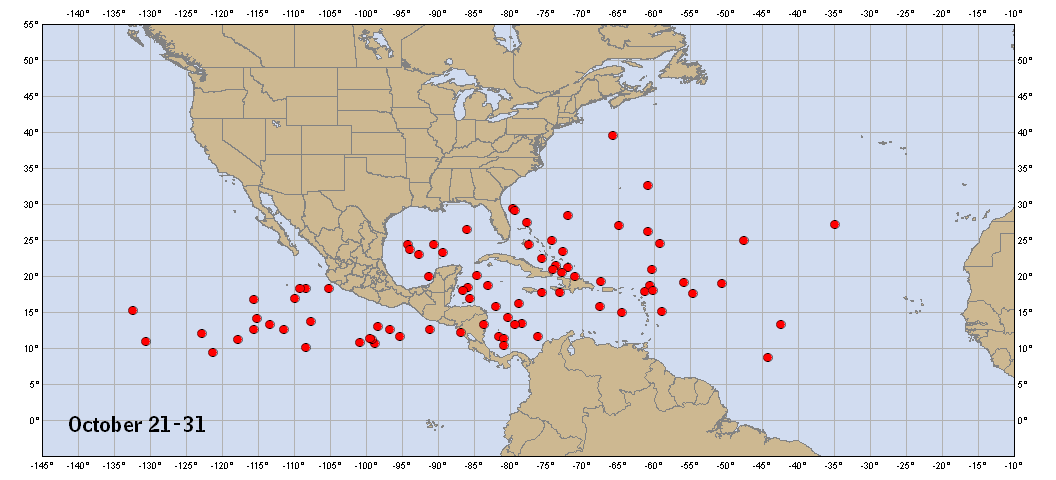
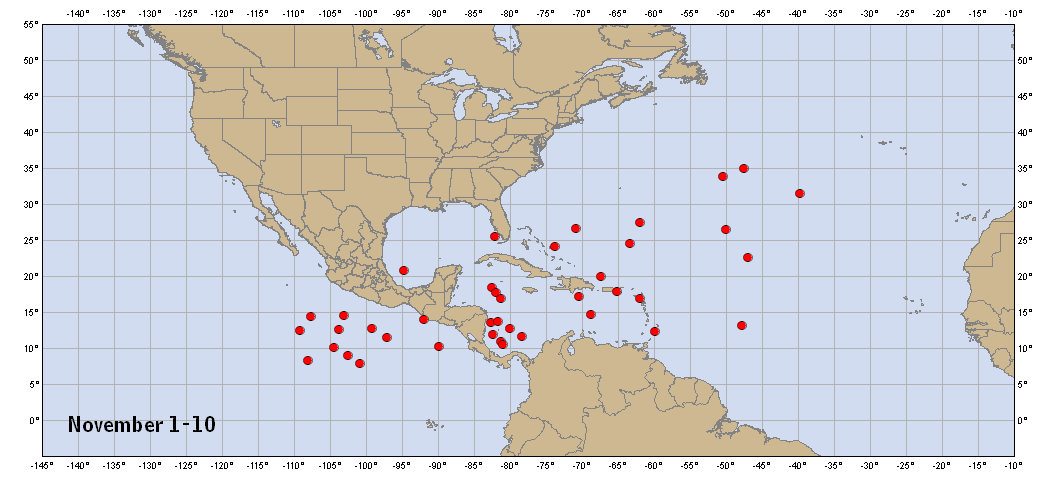
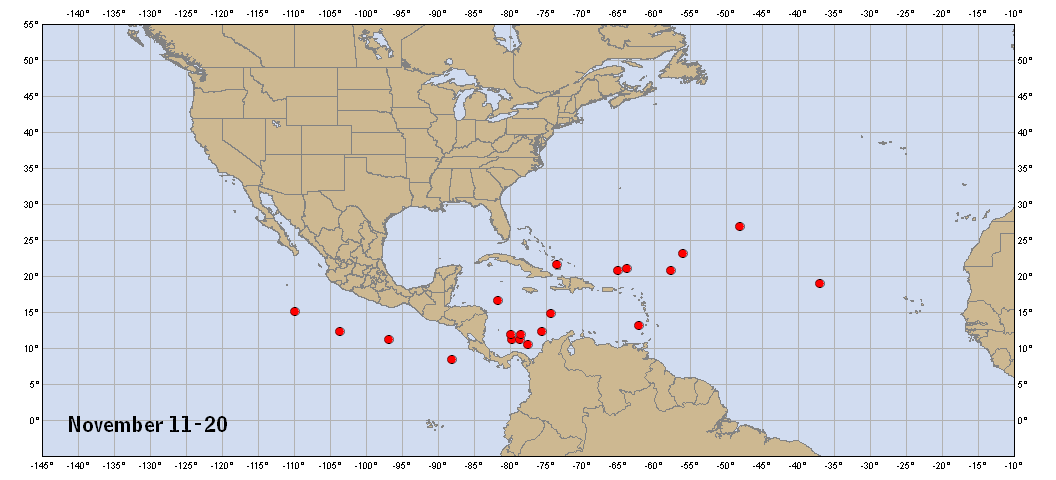
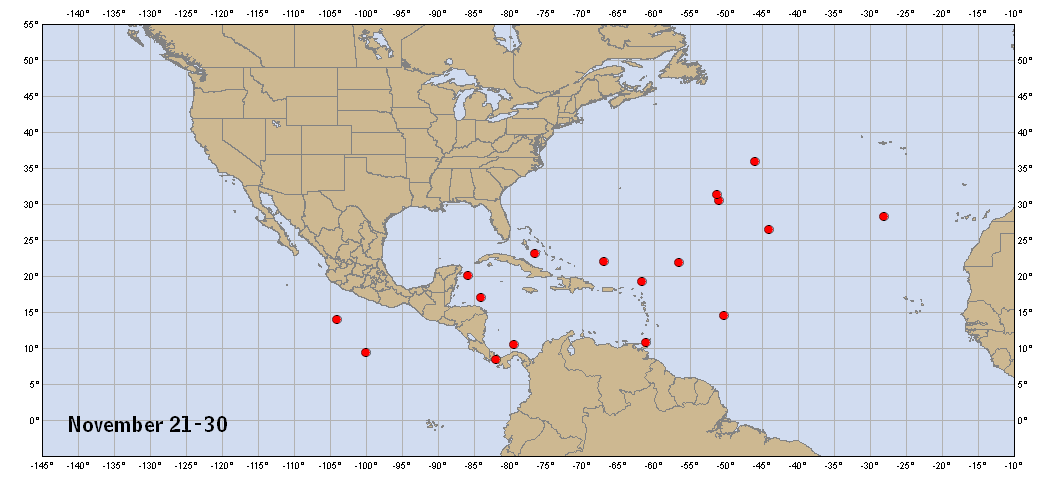
Points of Origin by 10-Day Period
The figures below show the points of tropical cyclone genesis by 10-day periods during the hurricane season. These figures depict named storms only; no subtropical storms or unnamed storms.
The source years include 1851-2009 for the Atlantic and 1949-2009 for the Eastern Pacific from the HURDAT database.
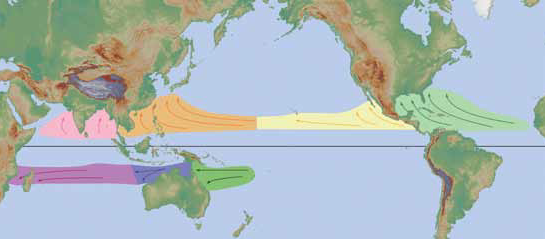
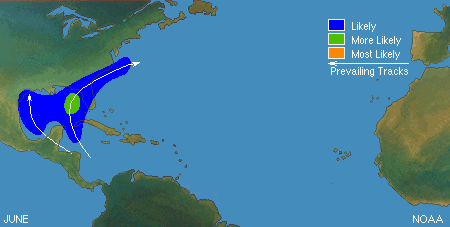
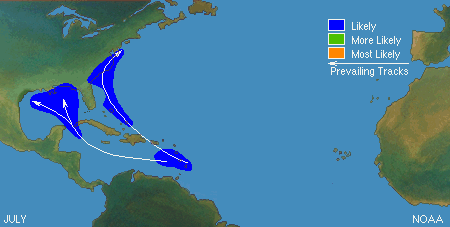
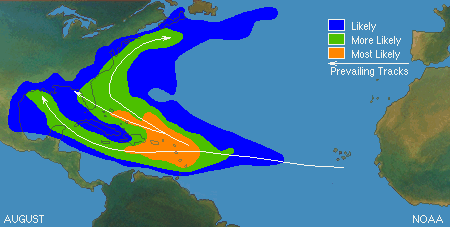
Climatological Areas of Origin and Typical Hurricane Tracks by Month
The figures below show the zones of origin and tracks for different months during the hurricane season. These figures only depict average conditions. Hurricanes can originate in different
locations and travel much different paths from the average. Nonetheless, having a sense of the general pattern can give you a better picture of the average hurricane season for your
area.
High Resolution History Maps
Named Cyclones by Year
![[Graph of Tropical Cyclone Activity in the Atlantic Basin]](images/atlhist_lowres_sm.gif)
Bars depict number of named systems (open/yellow),
hurricanes (hatched/green), and category 3 or greater (solid/red), 1886-2004
Download high resolution image
Hurricane Return Periods
Hurricane return periods are the frequency at which a certain intensity of hurricane can be expected within a given distance of a given location (for the below images 50 nm or 58 statute miles).
In simpler terms, a return period of 20 years for a major hurricane means that on average during the previous 100 years, a Category 3 or greater hurricane passed within 50 nm (58 miles)
of that location about five times. We would then expect, on average, an additional five Category 3 or greater hurricanes within that radius over the next 100 years.
More information on return periods can be found from NOAA Technical Memorandum NWS NHC 38 (pdf) on the NHC Risk Analysis Program (HURISK).
![[Map of return period in years for hurricanes passing within 50 nautical miles]](images/return_hurr_sm.jpg)
Estimated return period in years for hurricanes passing
within 50 nautical miles of various locations on the U.S. Coast
![[Map of return period in years for major hurricanes passing within 50 nautical miles]](images/return_mjrhurr_sm.jpg)
Estimated return period in years for major hurricanes passing
within 50 nautical miles of various locations on the U.S. Coast
CONUS Hurricane Strikes
![[Map of 1950-2011 CONUS Hurricane Strikes]](images/conus_hurrStrikes_1950-2011_sm.png)
1950-2011 CONUS Hurricane Strikes (Courtesy of NCDC)
CONUS Hurricane Strike Density (county maps)
![[Map of 1900-2010 Hurricane Strikes by U.S. counties/parishes]](images/strikes_us_sm.jpg)
1900-2010 U.S. Hurricane Strikes
![[Map of 1900-2010 Hurricane Strikes by U.S. counties/parishes (West Gulf)]](images/strikes_wgulf_sm.jpg)
1900-2010 U.S. Hurricane Strikes - West Gulf
![[Map of 1900-2010 Hurricane Strikes by U.S. counties/parishes (East Gulf)]](images/strikes_egulf_sm.jpg)
1900-2010 U.S. Hurricane Strikes - East Gulf
![[Map of 1900-2010 Hurricane Strikes by U.S. counties/parishes (Southeast)]](images/strikes_se_sm.jpg)
1900-2010 U.S. Hurricane Strikes - Southeast
![[Map of 1900-2010 Hurricane Strikes by U.S. counties/parishes (Northeast)]](images/strikes_ne_sm.jpg)
1900-2010 U.S. Hurricane Strikes - Northeast
![[Map of 1900-2010 Major Hurricane Strikes by U.S. counties/parishes]](images/strikes_us_mjr_sm.jpg)
1900-2010 U.S. Major Hurricane Strikes
![[Map of 1900-2010 Major Hurricane Strikes by U.S. counties/parishes (West Gulf)]](images/strikes_wgulf_mjr_sm.jpg)
1900-2010 U.S. Major Hurricane Strikes - West Gulf
![[Map of 1900-2010 Major Hurricane Strikes by U.S. counties/parishes (East Gulf)]](images/strikes_egulf_mjr_sm.jpg)
1900-2010 U.S. Major Hurricane Strikes - East Gulf
![[Map of 1900-2010 Major Hurricane Strikes by U.S. counties/parishes (Southeast)]](images/strikes_se_mjr_sm.jpg)
1900-2010 U.S. Major Hurricane Strikes - Southeast
![[Map of 1900-2010 Major Hurricane Strikes by U.S. counties/parishes (Northeast)]](images/strikes_ne_mjr_sm.jpg)
1900-2010 U.S. Major Hurricane Strikes - Northeast
Learn more about climate impacts from the NWS Climate Prediction Center.
|
|
![[graph of average cumulative number of Atlantic basin systems per year]](images/cum-average_Atl_1966-2009.gif)
![[graph of average cumulative number of Eastern Pacific basin systems per year]](images/cum-average_Pac_1971-2009.gif)


![[Tropical Cyclone History Map for Atlantic and Eastern Pacific]](images/1851_2010_tc_sm.jpg)
![[Hurricane History Map for Atlantic and Eastern Pacific]](images/1851_2010_hurr_sm.jpg)
![[Major Hurricane History Map for Atlantic and Eastern Pacific]](images/1851_2010_mjrhurr_sm.jpg)
![[Graph of Tropical Cyclone Activity in the Atlantic Basin]](images/atlhist_lowres.gif)
![[Map of return period in years for hurricanes passing within 50 nautical miles]](images/return_hurr.jpg)
![[Map of return period in years for major hurricanes passing within 50 nautical miles]](images/return_mjrhurr.jpg)
![[Map of 1950-2011 CONUS Hurricane Strikes]](images/conus_hurrStrikes_1950-2011.png)
![[Map of 1900-2010 Hurricane Strikes by U.S. counties/parishes]](images/strikes_us.jpg)
![[Map of 1900-2010 Hurricane Strikes by U.S. counties/parishes (West Gulf)]](images/strikes_wgulf.jpg)
![[Map of 1900-2010 Hurricane Strikes by U.S. counties/parishes (East Gulf)]](images/strikes_egulf.jpg)
![[Map of 1900-2010 Hurricane Strikes by U.S. counties/parishes (Southeast)]](images/strikes_se.jpg)
![[Map of 1900-2010 Hurricane Strikes by U.S. counties/parishes (Northeast)]](images/strikes_ne.jpg)
![[Map of 1900-2010 Major Hurricane Strikes by U.S. counties/parishes]](images/strikes_us_mjr.jpg)
![[Map of 1900-2010 Major Hurricane Strikes by U.S. counties/parishes (West Gulf)]](images/strikes_wgulf_mjr.jpg)
![[Map of 1900-2010 Major Hurricane Strikes by U.S. counties/parishes (East Gulf)]](images/strikes_egulf_mjr.jpg)
![[Map of 1900-2010 Major Hurricane Strikes by U.S. counties/parishes (Southeast)]](images/strikes_se_mjr.jpg)
![[Map of 1900-2010 Major Hurricane Strikes by U.S. counties/parishes (Northeast)]](images/strikes_ne_mjr.jpg)